Understanding the landscape of data science salaries is crucial for job seekers and employers alike. To provide a clear picture, I developed a Tableau dashboard showcasing average data science job salaries worldwide.
Explore the dashboard on Tableau Public!
(Original database on Kaggle)
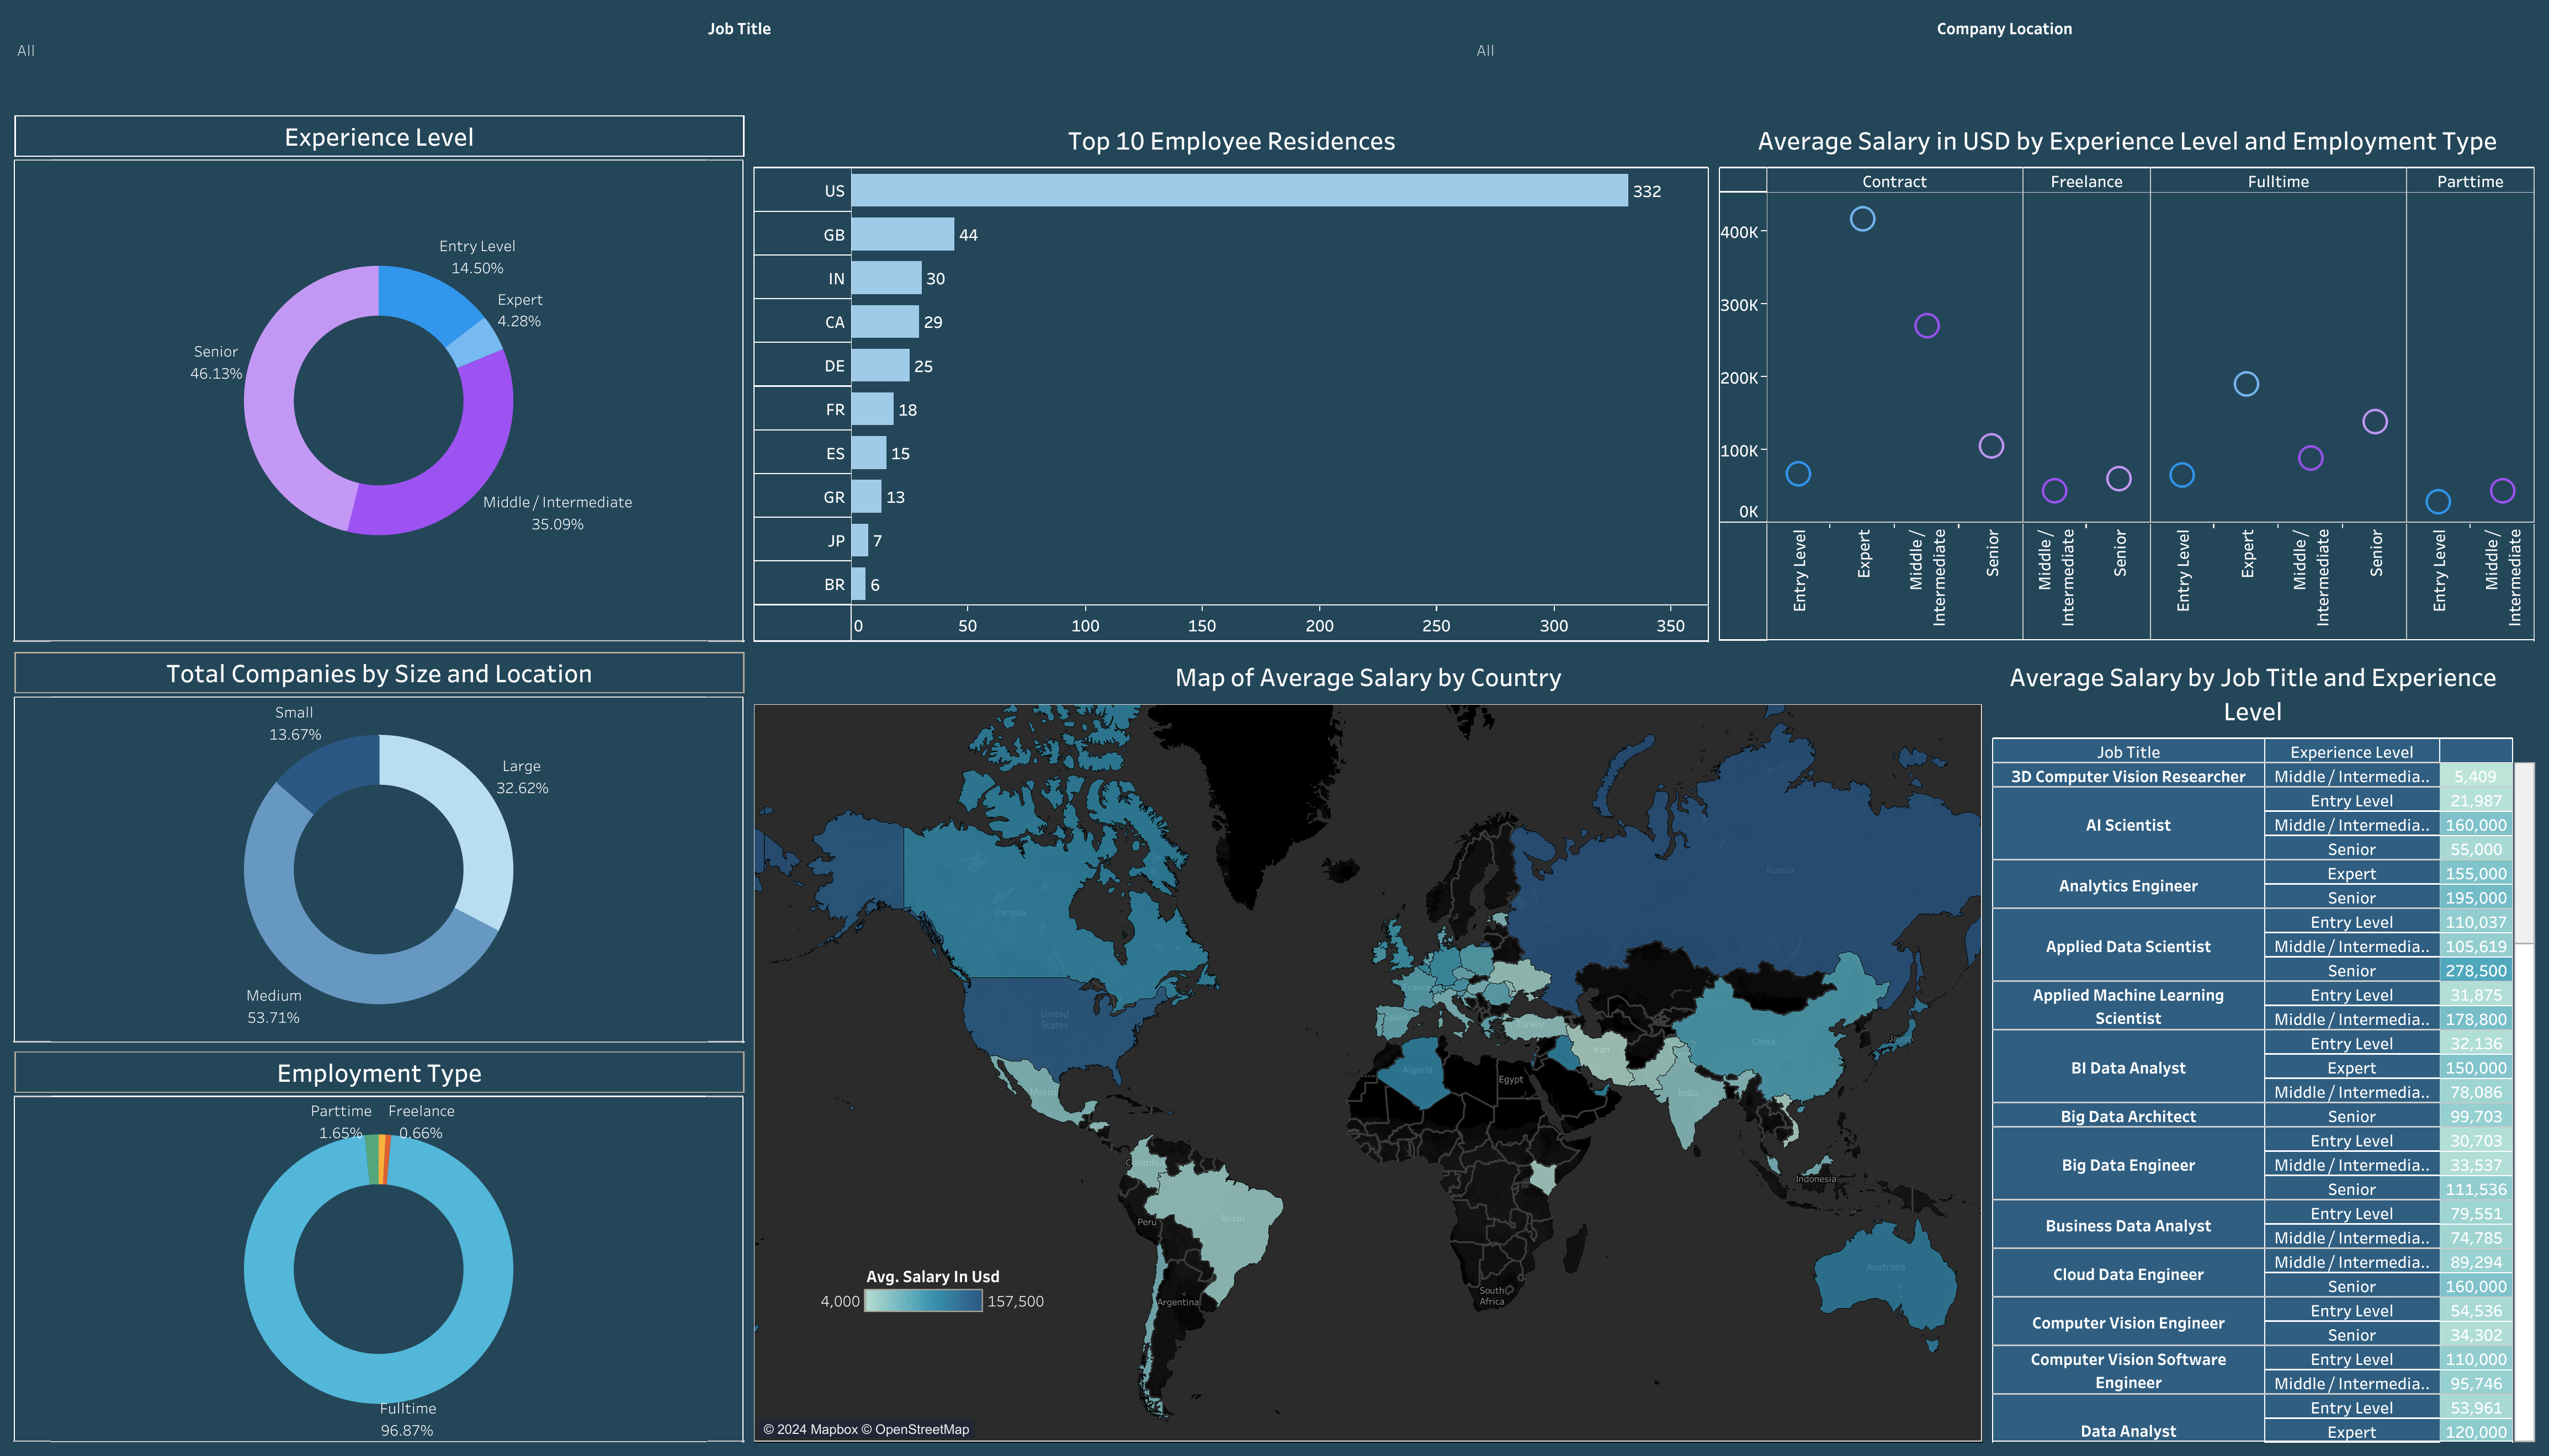
Key Features:
- Donut Charts: Illustrate salary distribution by company size, experience level, and employment type.
- Global Map: Displays average salaries per country.
- Top 10 Residences: Highlights the regions with the most data science professionals.
- Salary Breakdown: Shows average salaries in USD by experience level and employment type (freelance, part-time, full-time, contract).
- Job Title Analysis: Compares average salaries by job title and experience level.
Insights:
- Regional Differences: North America and Western Europe offer the highest average salaries for data scientists, reflecting higher demand and cost of living.
- Company Size Impact: Larger companies tend to pay higher salaries compared to smaller firms.
- Experience Matters: Senior data scientists earn significantly more, with salaries increasing steadily with experience.
- Employment Type Variation: Full-time roles typically offer higher salaries compared to freelance, part-time, and contract positions.
- Job Title Comparison: Specialized roles like Data Engineers and Machine Learning Engineers command higher salaries than generalist Data Scientists.
This dashboard provides comprehensive insights into global data science salary trends, aiding professionals and employers in making informed decisions.