Browse the official project website with progress presentations!
View the code for this portion of the project at Deepnote or Github!
View the report document detailing the entire process here!
Partner is the leading provider of engineering, environmental, construction, energy, and valuation consulting for the commercial real estate industry.
In hopes of simplifying their Property Condition Assessment (PCA) report, this project aimed to assess the associations between different structural component attributes, and to evaluate whether certain attributes imply the presence of others.
Goals:
- Evaluate the correlation between the key attributes given to us via a set of hypotheses based on Partner’s domain knowledge
- The hypotheses are relevant to the data variables collected in Sections 1, 4, and 5 of the PCA report.
- Based on these correlations, build a model that is able to predict the wood frame presence based on our chosen predictors as a base to what could evolve into an autofill system for the PCA reports.
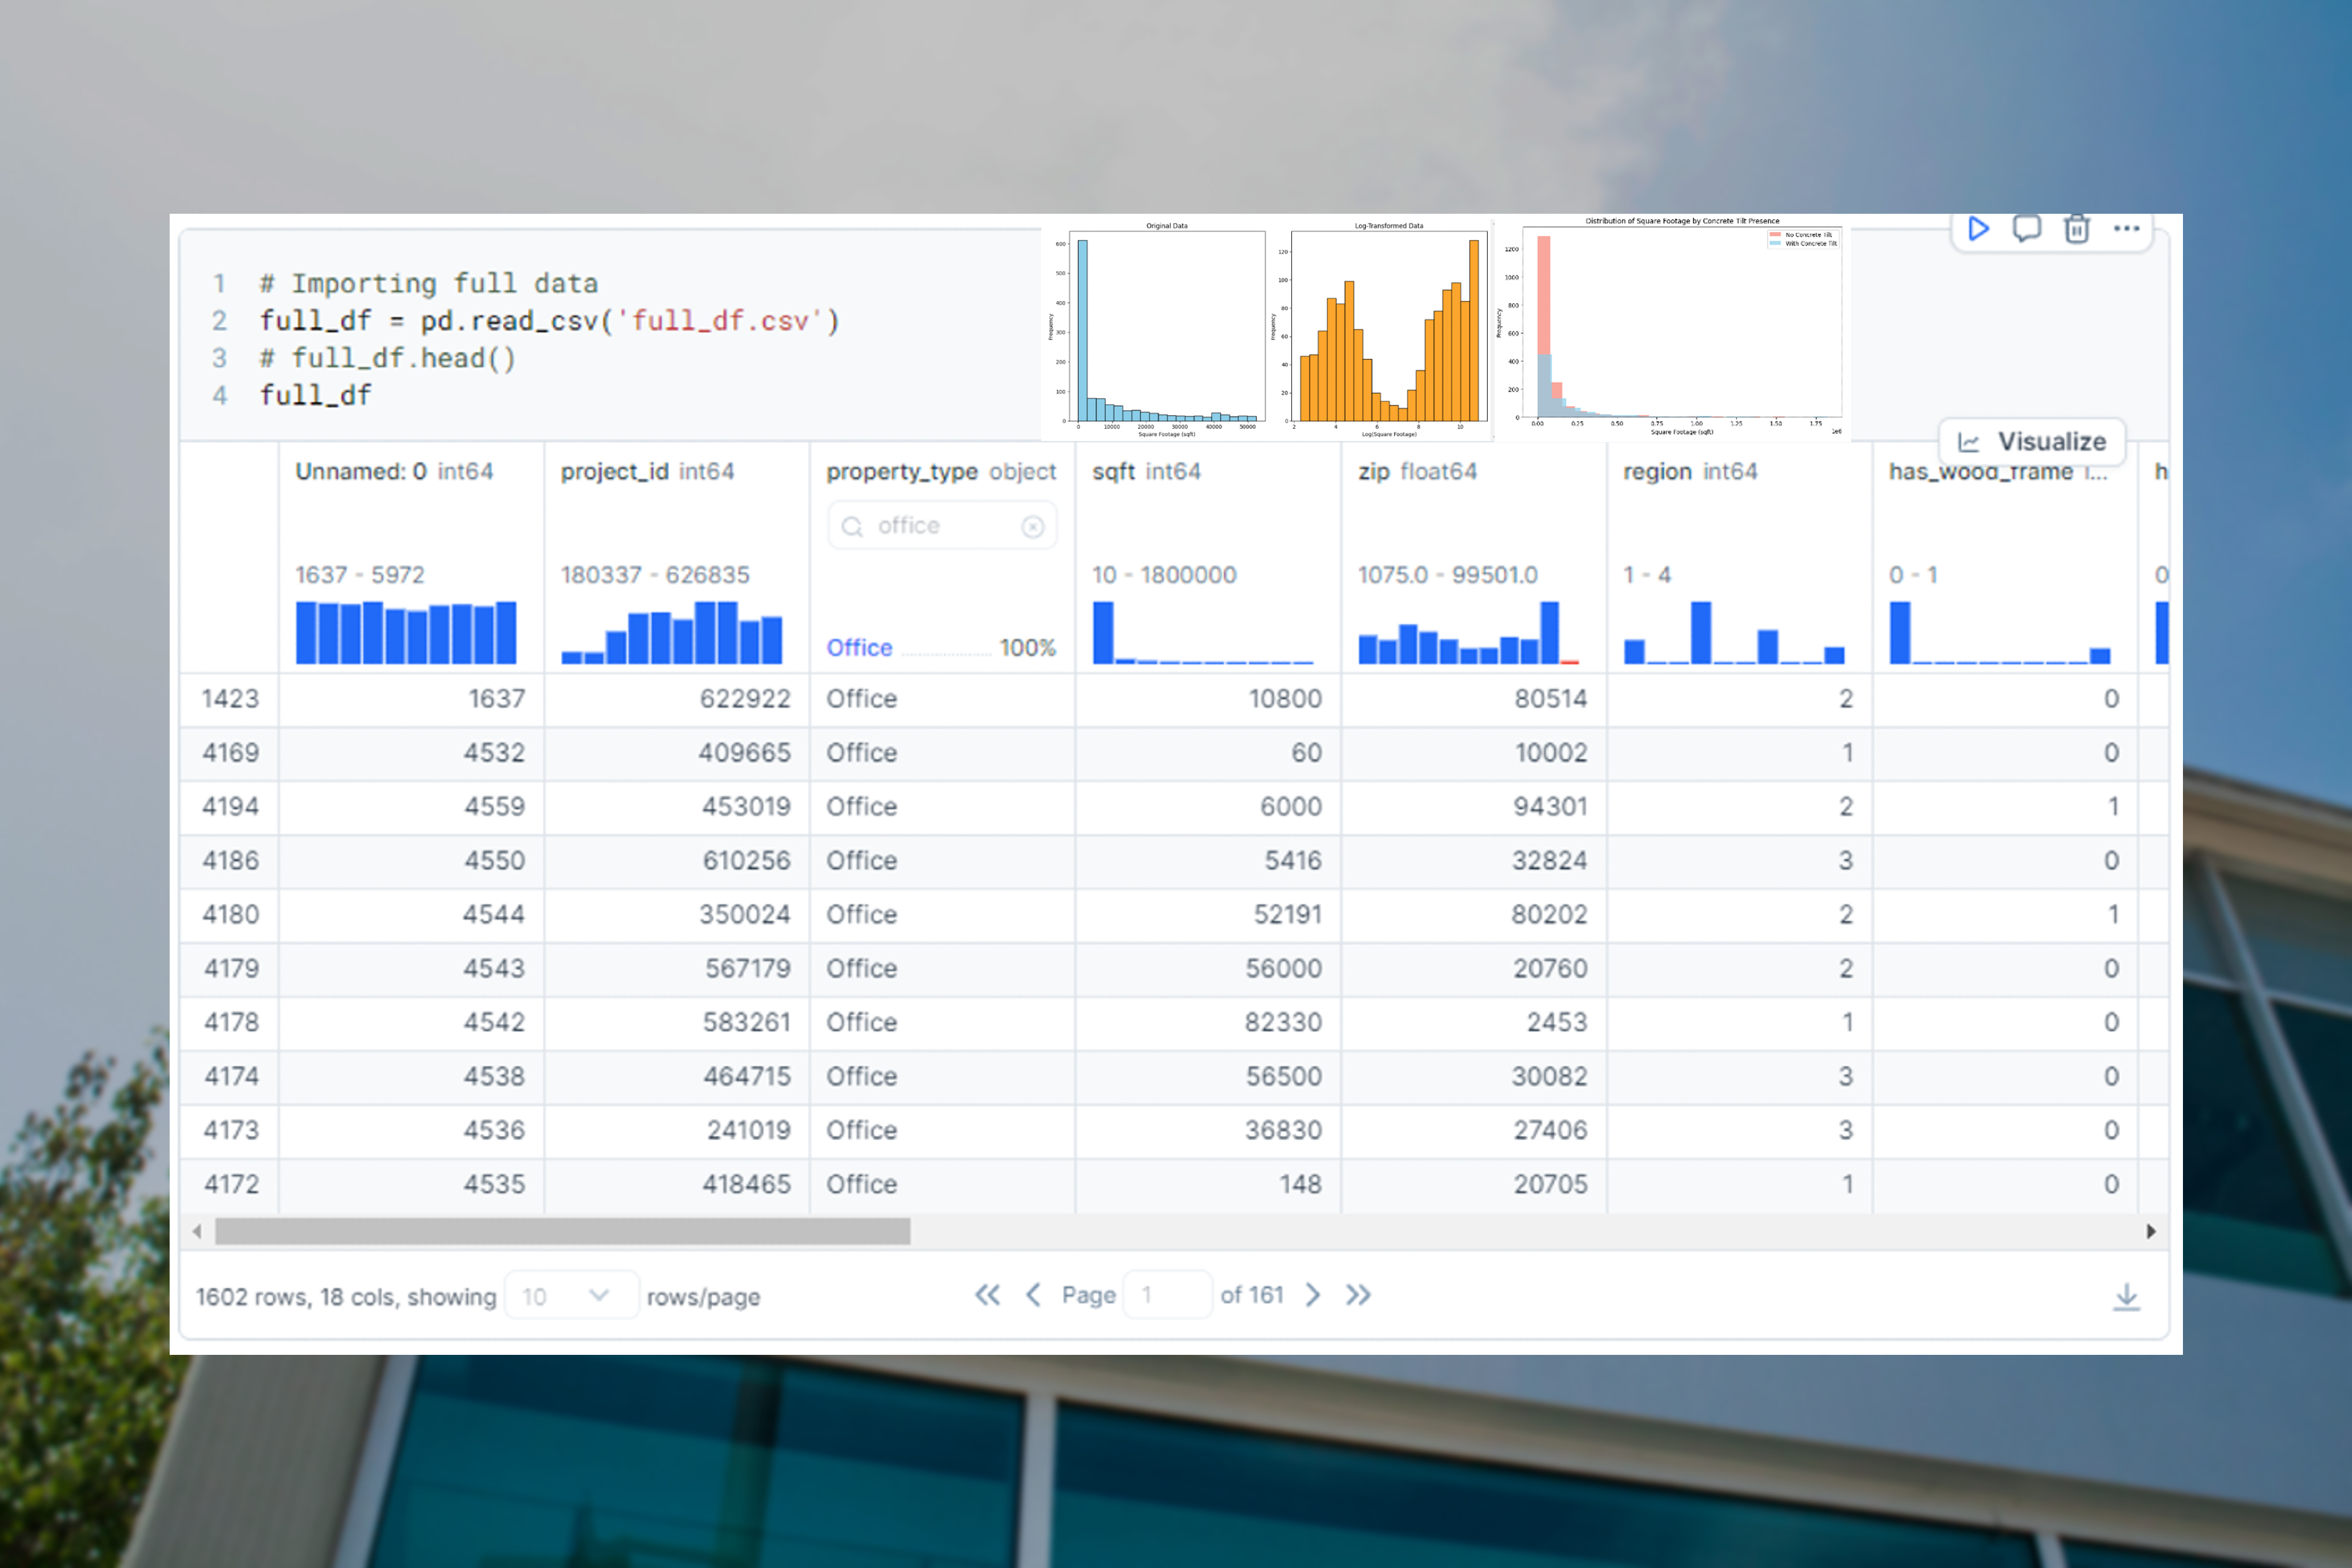
Data Wrangling
Data wrangling and cleaning proved to be the most challenging and time consuming aspect of the project due to the following factors:
- The provided raw dataset was “flipped”, with rows corresponding to individual attributes of one property, rather than to the property itself with corresponding columns.
- There were many instances of irrelevant & unusable data, such as properties with multiple buildings, which skews results.
- Response data often consisted of a mixture of text, numbers, and arrays, rather than standardized responses from a finite list.
The data was ultimately restructured by unique property ID, dropping impertinent features and reformatting unwieldy responses to streamline the EDA process.
Another dataset that was used in our analysis converted the zip codes in the raw data into regions in the country (northeast, midwest, southeast, southwest, and west). This was done to bin the zip codes into a meaningful format as a predictor.
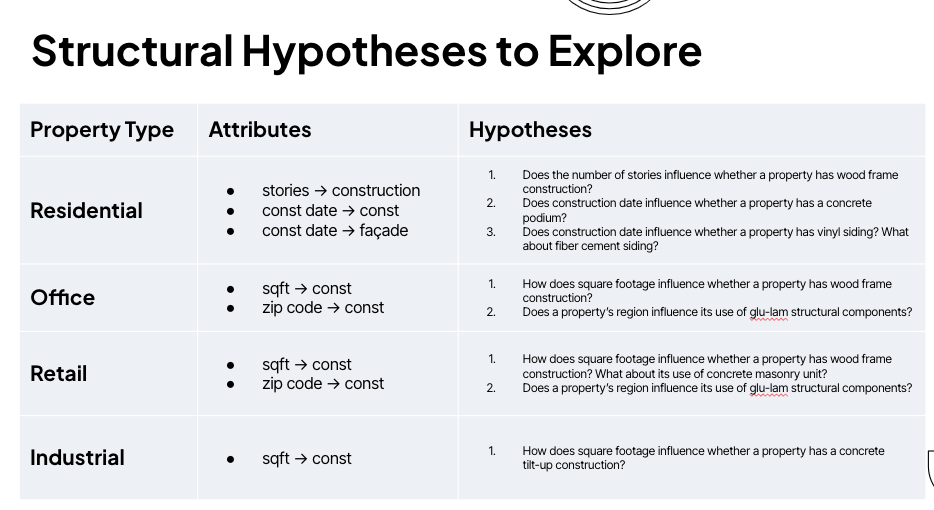
4. Overall Technical Approach
The EDA process consisted of investigating hypotheses about structural attribute relationships that were provided by Partner. The table below outlines the different hypotheses and their corresponding correlation result.
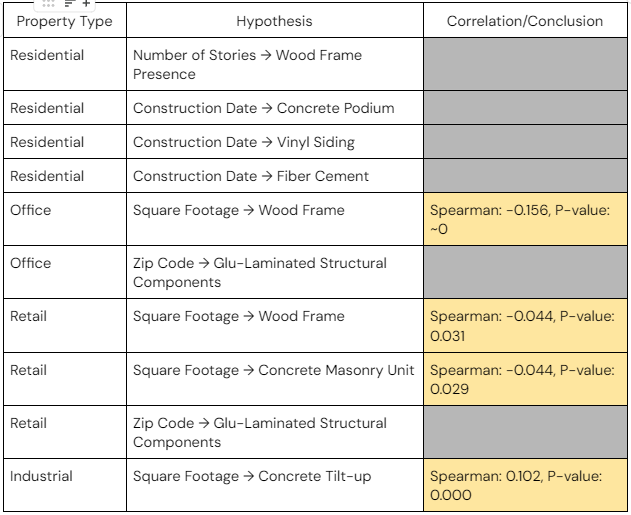
Greyed-out conclusions refer to inconclusive results due to there being too little data to perform correlation analysis (e.g. residential properties were too scarce in this dataset to make any valid statistical inferences). Yellow-colored conclusions refer to there being a very low correlation between attributes, but a strong indication that it does exist (i.e., low p-values). Note that although the p-values for such conclusions appear to be significant, it’s also important to consider its practicality. In other words, although the correlations appear to be significant, it may be due to there being a high volume of data, rather than because the relationships necessarily lead to impactful conclusions.