Browse the official project website with progress presentations!
View the code for this portion of the project at Deepnote or Github!
View the report document detailing the entire process here!
Partner is the leading provider of engineering, environmental, construction, energy, and valuation consulting for the commercial real estate industry.
In hopes of simplifying their Property Condition Assessment (PCA) report, this project aimed to assess the associations between different structural component attributes, and to evaluate whether certain attributes imply the presence of others.
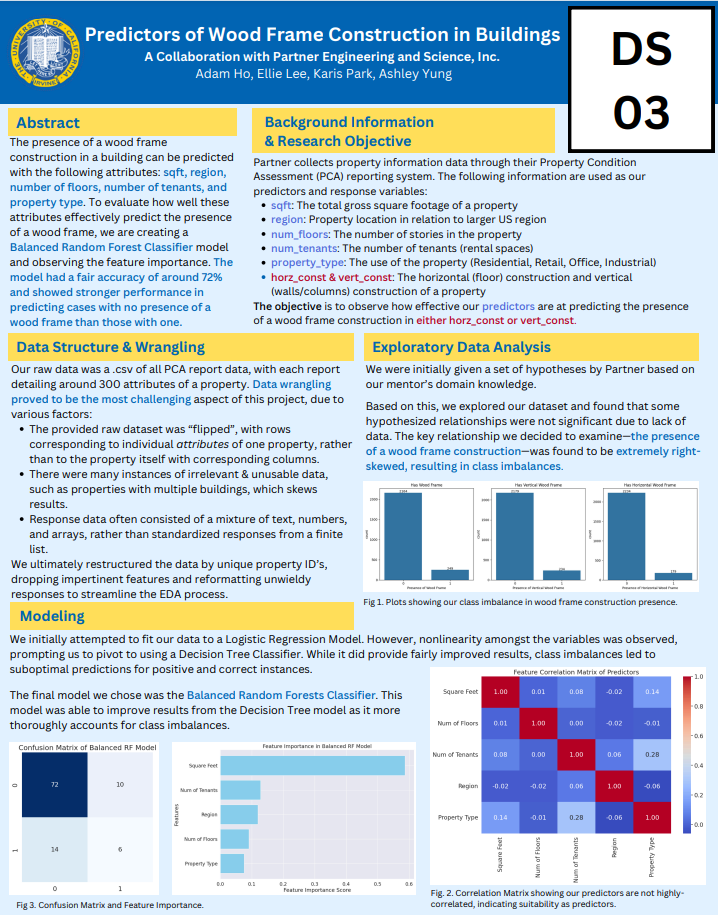
Based on the analysis detailed in the previous project post, I contributed in creating a machine learning model that utilizes a Balanced Random Forest classifier to predict the material of a given building's structural frame. This post details the journey in modeling that eventually won my team 3rd place at the 4th Annual ICS Expo!

Models Evolution:
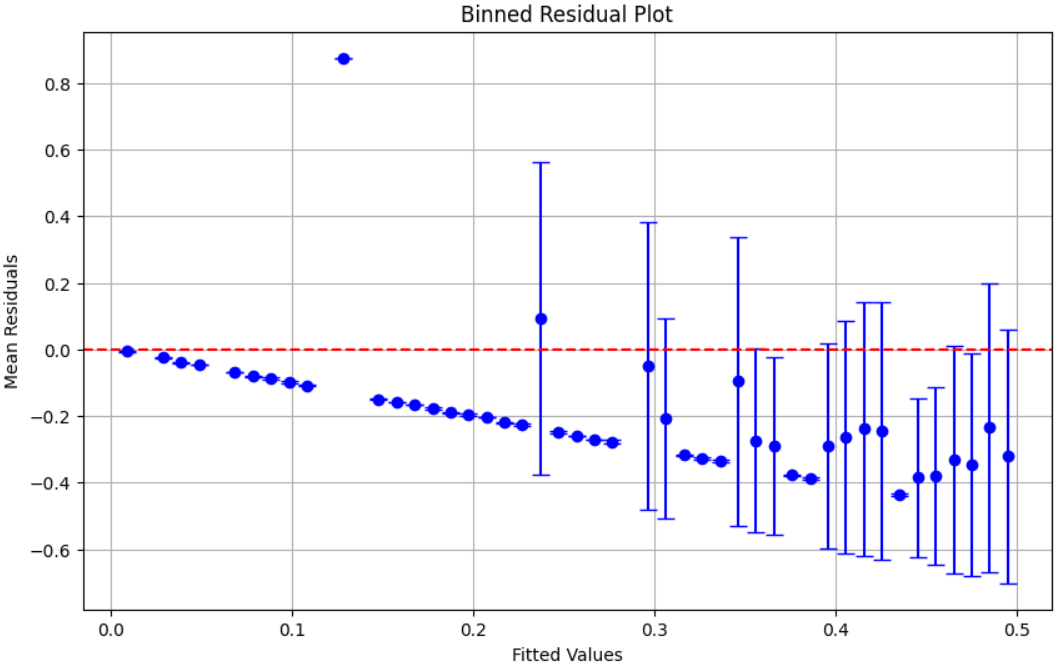
6A. Logistic Regression
Since the data has a binary response, we initially tried to fit our data in a logistic regression model. However, the linearity assumption was violated, and thus logistic regression could not be used.
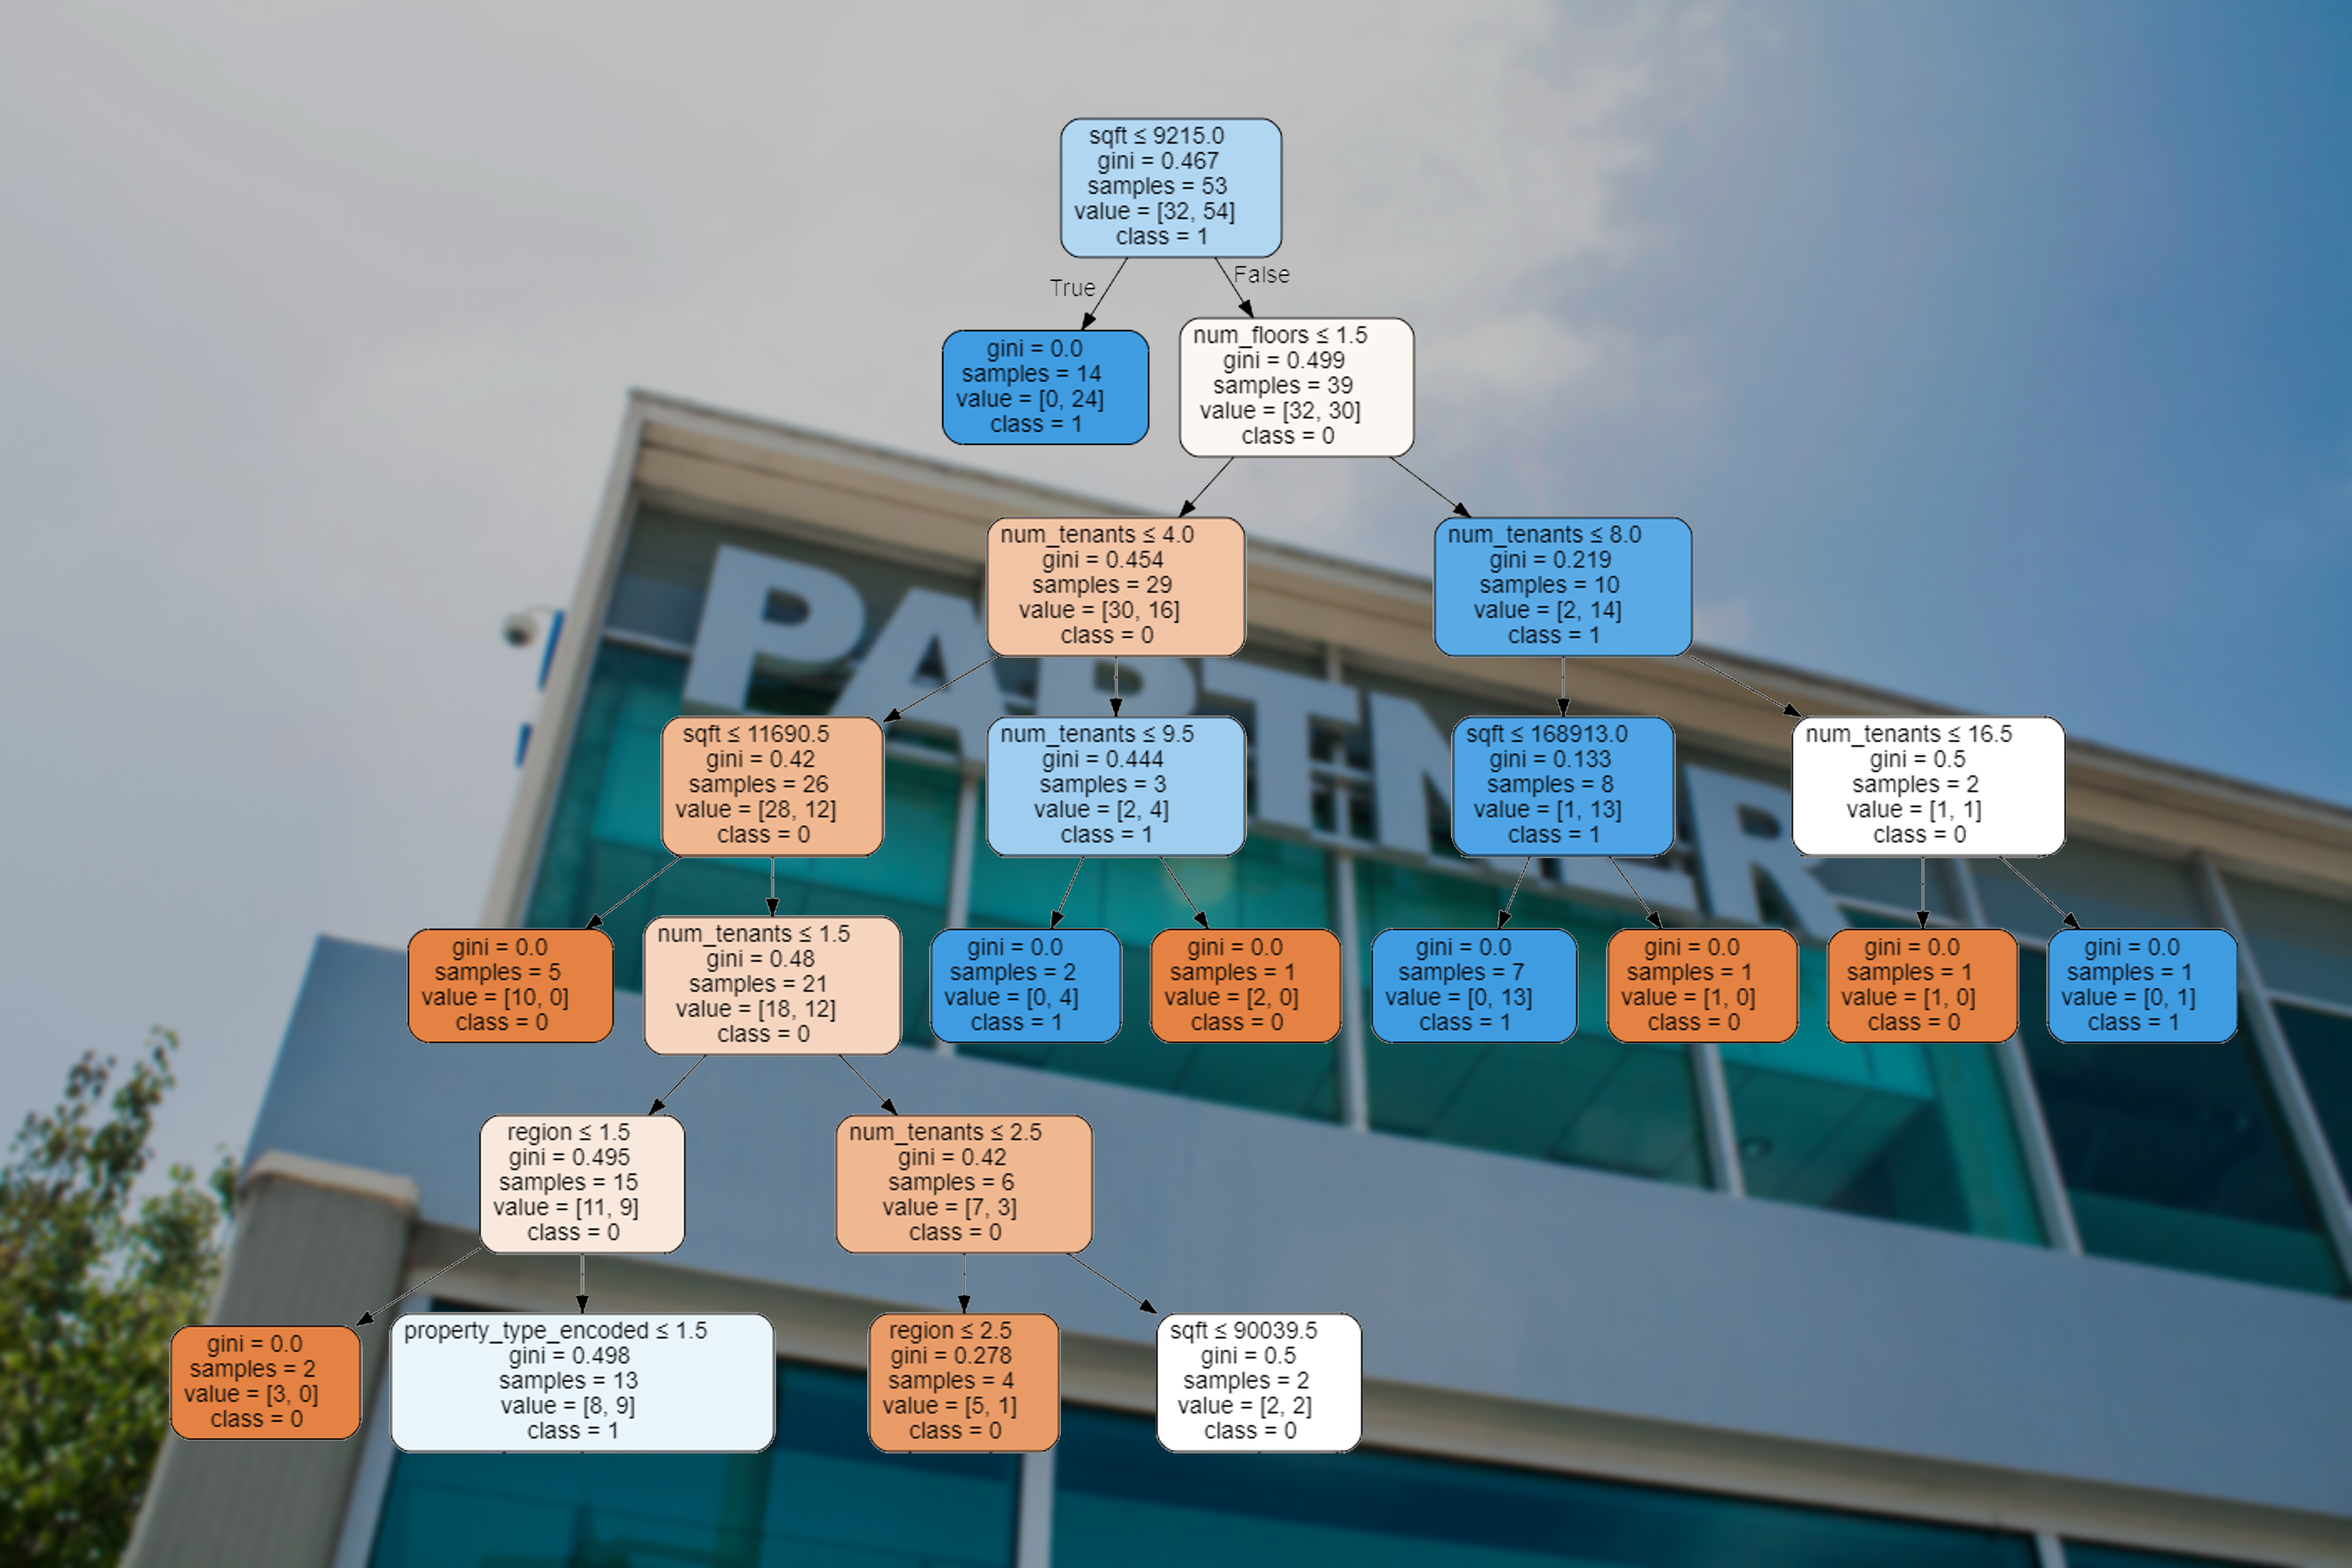
6B: Decision Tree Model
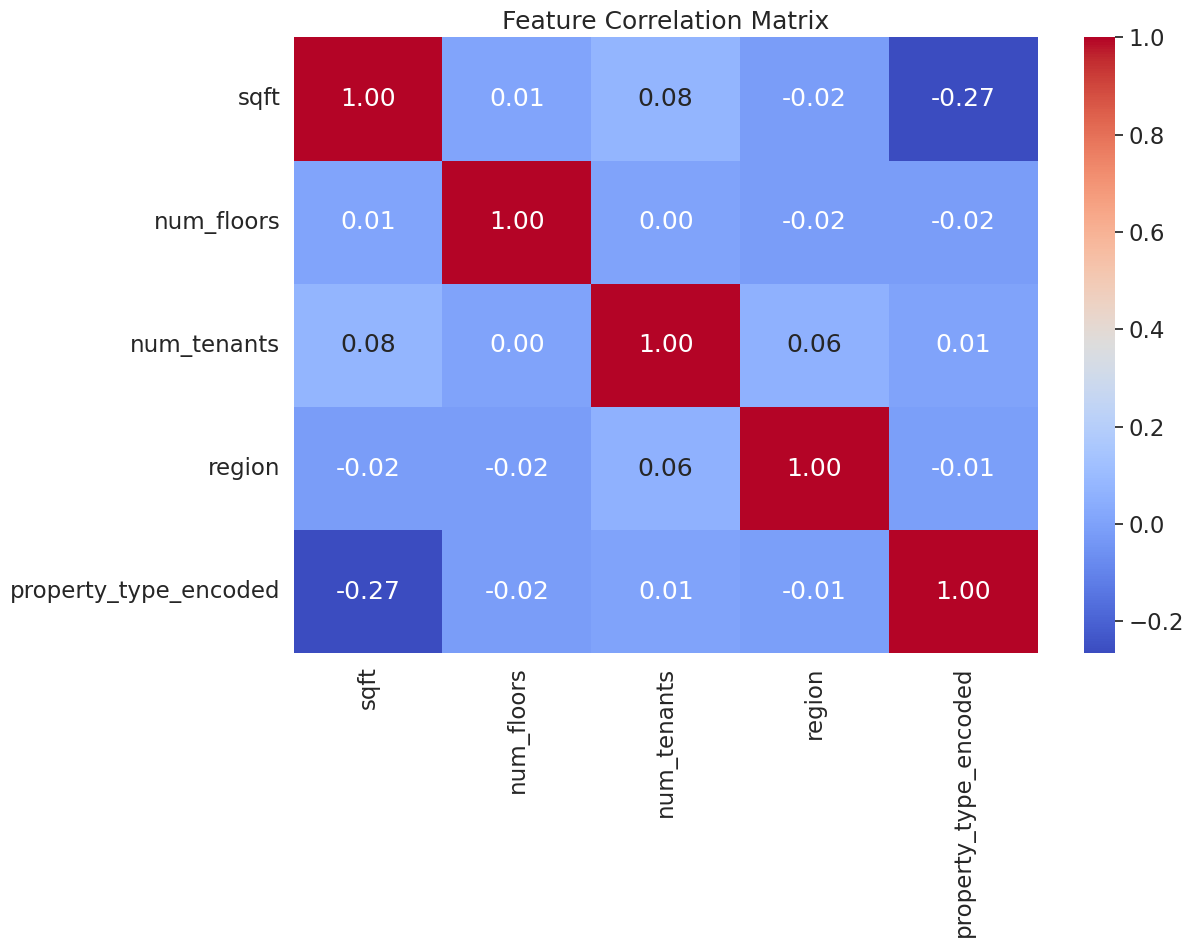
In order to check if the data could be used in the model, we first ran a correlation matrix to see if any of the attributes were highly correlated with each other. We found there were no high correlations, which justifies the use of this model for our dataset.
We first built the decision tree model using only square feet as a predictor for the presence of a wood frame, which is based on the proposed hypotheses that Partner gave us. This model gave a good accuracy score of 83.2% but a very low F1 score of 6.8%. Thus, we explored the dataset further, and based on our analysis and domain knowledge, we added the number of floors, number of tenants, region, and property type as predictors. This yielded an accuracy score of 85.9% and an F1 score of 32%. While better than the previous model, the F1 score still remains low due to class imbalances.
6C: Balanced Random Forests Model
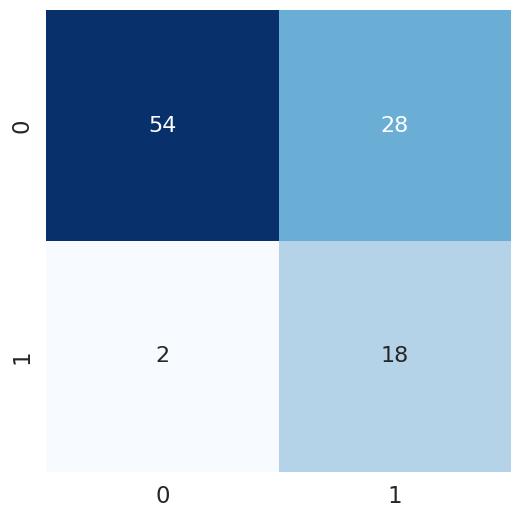
In order to account for the class imbalances between frame types, we sought to experiment with additional techniques that may improve our model’s accuracy. We first attempted to implement a Balanced Random Forest Model, which essentially draws an equal number of bootstrap samples from the minority (Wood Frame) and majority (No Wood Frame) classes, and then applies the random forest model on it, ideally avoiding any overfitting caused by imbalances. Fitting this model yielded an improvement in results from the baseline; while accuracy decreased to a more realistic 71%, the F1 Score greatly increased to 0.545. Intuitively, this meant that the model was getting slightly better at predicting true positives.
Next, in an effort to improve the accuracy of the model from that baseline, we introduced different weight values. Such changes included setting the weight parameter to be inversely proportional to class frequencies, as well as setting the parameter to be “balanced”. However, none of these tweaks to the weight introduced a significant improvement to the baseline model.
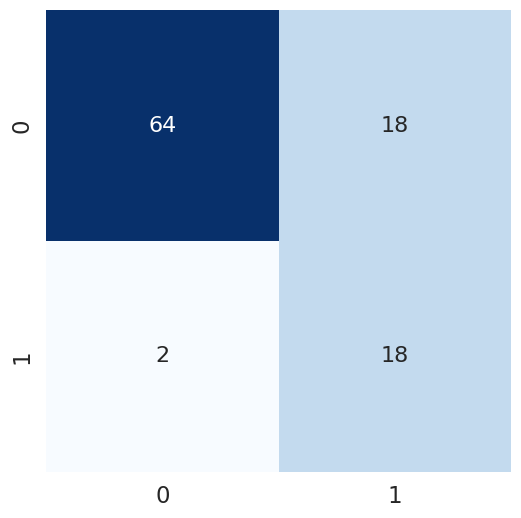
We additionally experimented with tuning hyperparameters in order to yield the most optimal scores on our testing set. This did improve the model, with accuracy reaching a peak of 80.4% and f1-score reaching 0.643. Some of the hyperparameters here include the criterion, minimum samples split, and max features arguments. However, the three most influential hyperparameter alterations were:
- Increasing the number of estimators (trees) - makes model less prone to effects of noise in individual trees
- Reducing max depth - reduces complexity / chance of overfitting
- Specifying criterion as ‘entropy’ - may produce more balanced trees than ‘gini’
6D: Grid Cross Cross-Validation and Synthetic Minority Over-Sampling Technique (SMOTE)
Although these changes resulted in the highest accuracy we’ve seen from the model thus far, we still wanted to utilize a technique that could automate the search for these optimal hyperparameters to see if the model could be refined even further.
Grid Cross Cross-Validation is a method that explores various combinations of hyperparameter values within a predetermined grid, and then it implements cross-validation to assess the performance of each combination of hyperparameters. With k = 5 folds, the best parameters were:
- 'criterion': 'gini'
- 'max_depth': 20/None
- 'max_features': 'log2'/’sqft’
- 'min_samples_leaf': 5
- 'min_samples_split': 2
- 'n_estimators': 180
The best parameters had an accuracy score of 76.9% and an F1 score of 33.1%, indicating we may need to account for overfitting in our previous models. Additionally, the model took around 15 minutes to run.
Sampling Minority Over-Sampling Technique, or SMOTE, is another technique that addresses class imbalance by generating new synthetic samples for the minority class (Wood Frame). We found, however, that this technique did not improve our metrics much, yielding an accuracy of 79.4% and an F1 score of 43.2%.